Churches Monitor PV Systems with PulseConnex
August 2015
|
Many organizations are looking to solar to provide relief from high electric bills, but with complicated net metering rates and data provided by the utility up to a month after occurrence, it can be hard to know how efficiently a solar PV array is operating. Since PulseConnex taps into pulse information directly from the meter, using PulseConnex with a solar PV system can provide visual confirmation of when a building is truly operating off the grid. Advent Lutheran ChurchWestminster, Colorado In 2014, Advent Lutheran Church sought to aggressively become more energy efficient by installing an Energy Sentry demand controller, a solar PV array, and PulseConnex to monitor the effectiveness of these measures. While PulseConnex does not track the amount of energy generated by the church’s solar power, the dual channel capability of PulseConnex allows them to monitor and compare energy sourced from their utility to overall energy consumption. When viewing either historical or real-time data, church administrators can see the church’s overall electric load rising (total load), as indicated by the violet line on the graph (see Fig 1). Contrasted on the same graph, energy provided by the utility is indicated by the blue line (kWh delivered), and drops to 0 by mid-morning, showing that the solar PV system is working as expected, generating all of the energy needed for the church on clear, sunny days. | |
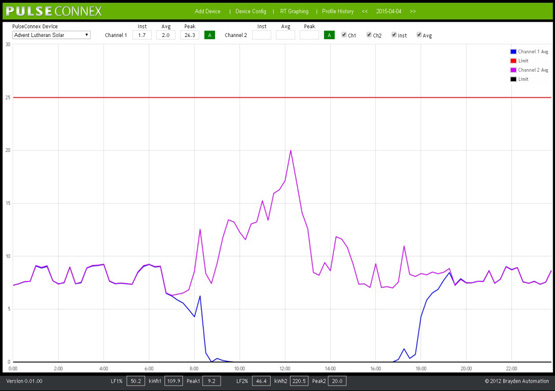 | Fig 1: Actual Load Profile History for Advent Lutheran on April 4, 2015. |
Arvada United Methodist ChurchArvada, Colorado Arvada United Methodist Church took a slightly more cautious approach to energy efficiency. In order to have a more complete picture of the effectiveness of a solar PV installation, Arvada UMC installed PulseConnex several months before installing a solar PV array. Now that their solar energy system is operational, they can use their historical load profile data to compare the church’s pre-solar energy consumption from the utility to the current consumption. | |
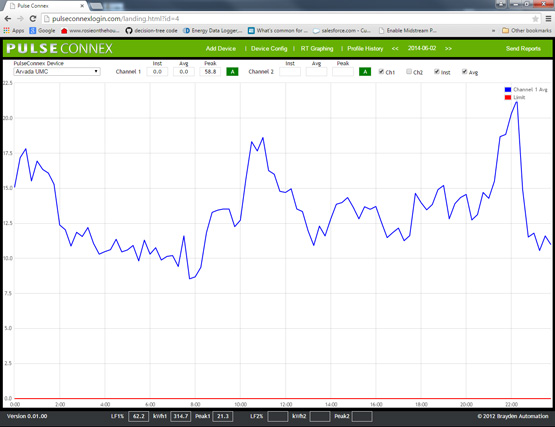 |
Fig 2.1 Actual Load Profile Data for Arvada UMC on June 2, 2014. The blue line indicates kWh delivered and total load (kW) before the solar PV array was installed. |
|
|
Fig 2.2 Actual Load Profile Data for Arvada UMC on June 2, 2015 Now, the blue line indicates only kWh delivered from the utility, which drops to zero when the solar PV array is providing 100% of the church’s energy. |
|
Ensure your customers are getting the most out of their new solar installations by helping them monitor their energy use in real-time or with accurate historical pulse data. PulseConnex is inexpensive and easy to implement. Call us at 1-888-BRAYDEN to bring real-time energy information to your customers. | |