What is Demand?
May 2011
This is a fairly complex topic that we could dedicate a whole newsletter to, but we’ll try to keep it short and sweet.
Car AnalogyThink of your electric use in terms of a car. | |
 |
|
|
When thinking in terms of electricity; Kwh is ENERGY which is the amount of electricity consumed Below are equations for calculating both Kwh and KW. To Calculate Kwh (Energy)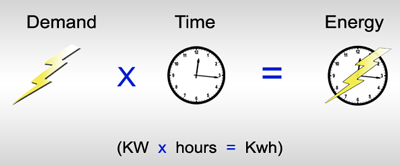
To Calculate KW (Demand)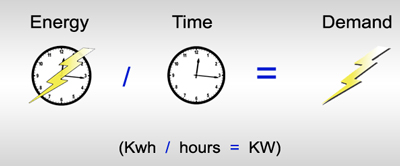
| |
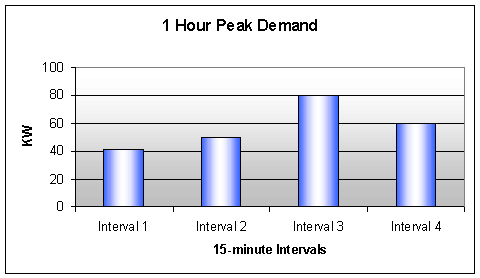
Why you should care about Demand (KW)Your electric bill is the most relevant area demand appears. For all commercial customers and some residential customers (depending on the utility) there is a portion of the electric bill called a Demand Charge. The Demand Charge is the amount you are charged per KW, and this depends on what Demand Rate the utility places you on. There are three basic rate classes; Small General Service (SGS), Medium General Service (MGS) and Large General Service (LGS). For this explanation we will focus on SGS and MGS. In many cases, SGS has the demand charge embedded within the Kwh charge. MGS usually has the regular Kwh charge plus a demand charge. Many times the rate threshold between SGS and MGS is 25KW. So for some businesses the goal is to stay below 25KW to remain on the SGS rate and obtain lower total costs on their electric bills. So how does the utility determine which Demand Rate to place you on? Well it all depends on your Peak Demand. Most utilities divide your electric use into 15-minute intervals. The meter averages your Kwh use for each of those 15-minute intervals. The highest 15-minute interval (in that billing period) is your peak demand for that month. In an average 1 month billing period you have about 3,000 opportunities to set the peak demand. Example: This table shows one hour of electric use- only 4 of 3,000 intervals in a typical month/billing period. As you can see, 80KW ends up being the Peak Demand out of these four 15-minute intervals. 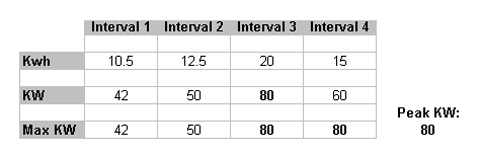
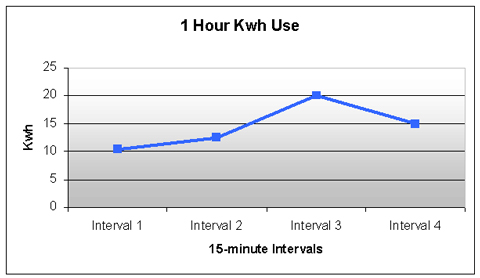
Example: This graph shows the Kwh use from the table above.
Example: This graph shows KW from the table above. As you can see Interval 3 with 80KW ends up being the Peak Demand out of these four intervals.
So even if you stayed well below the 25KW threshold for 2,999 15-minute intervals, and only went over 25KW for one interval, you would still be moved to the MGS rate and pay demand charges. Many utilities require you to be below the threshold for 6 months or even a year before they move you to the lower SGS rate. So it’s very important to know your demand in order to remain on the desired rate and/or save money on your electric costs. | |